
Collect student viewing data in Kaltura Mediaspace
Kaltura MediaSpace, UAF’s video and media delivery platform, gives users greater control over their videos than other platforms such as YouTube. One powerful feature that is potentially useful for instructors is viewing analytics. Because Mediaspace is integrated with the UA single sign-on and Blackboard, data is gathered about each student’s watch patterns for a video.
After publishing your video, you can see which students watched or didn’t watch, how long each student watched of the video. Rather than seeing a single number of views per video Kaltura tracks per-user view counts.
To see detailed analytics, publish your video in one of two ways. Publish it to a channel that requires UA login in credentials or deploy it in your Blackboard course directly from your Media Gallery. Both methods have the e ect of capturing per-user viewership and engagement. If a video is published in multiple places, and one of those is public, you will not get user information about viewers accessing it from the public URL. You will simply see “Unknown’ and the number of views from that source. Unfortunately, because Kaltura treats embed codes as public, if you embed your video in your course you lose the ability to see per- user information.
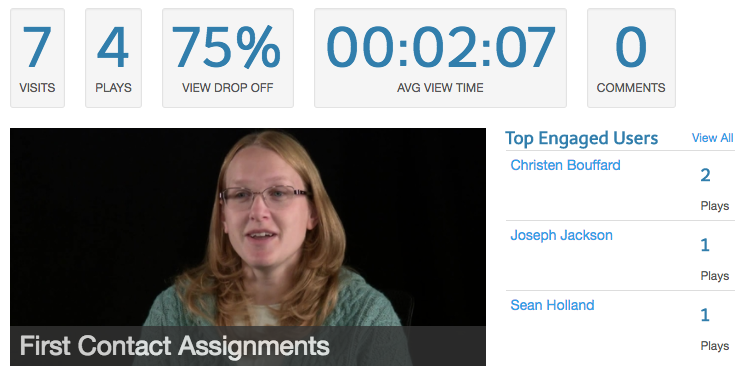
Pictured is the main analytics page for a recently published faculty interview. It shows the aggregate visits and plays for all users and the average total time they watched the video. This view is similar for publicly deployed videos. You will be able to see how many plays overall and how long on average people watched before stopping.
If you published your video to a login-required channel such as eCampus Productions or deployed it from within a Blackboard course’s Media Gallery, you can gather more specific per-viewer analytics like this:
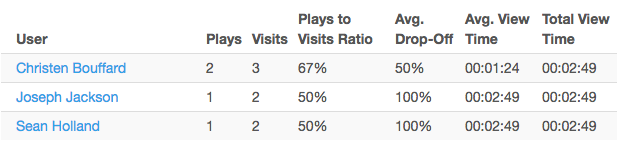
For each user listed, you see how many times they played the video, versus how many times they visited the video page, resulting in a percentage of plays-to-visits. How many times did students land on the video page but not bother clicking play? To the right of this is a more useful number: Average Drop-Off, which indicates length of time a viewer watched before closing the page or pausing the video and never restarting it.
Why would you want this information as an instructor? One, to determine student engagement. If a student visits your video page four times but never plays the video, that might be useful information later on if that student does poorly on an assessment. Contrarily, a student who watched a video five times with a 100% drop-o rate (the entire length) may do well on the same assessment. is gives you a better sense of the why of student success in your course.
Two, to evaluate the effectiveness of your own materials. If the two example students above both did poorly on an assessment, perhaps the video itself was not adequate. Additionally, the overall drop-off rate may tell you whether your video content is too long. Keep it short. Studies indicate videos longer than just three minutes can result in falling engagement by university-level students. ¹ They may keep watching, but they will certainly skip around to and the part of the video they feel is relevant.
Curious? Watch the corresponding screencast below:
References
1. Bowles-Terry, M., Hensley, M. K., & Hinchliffe, L. J. (2010). Best practices for online video tutorials in academic libraries: A study of student preferences and understanding. Communications in Information Literacy, 4(1), 17-28.