Visualization – gorgeous ways to present data online
Learning environments where students are active creators can help foster engagement and a sense of accomplishment. If your students are involved in data analysis and presentation, using these exciting and interactive tools could help them get hooked on working with data. These online interfaces are extremely easy to use and accept data in a variety of formats. Once completed, visualizations can be embedded into Blackboard or other website. In some cases, viewers of the figures can also interact with the data.
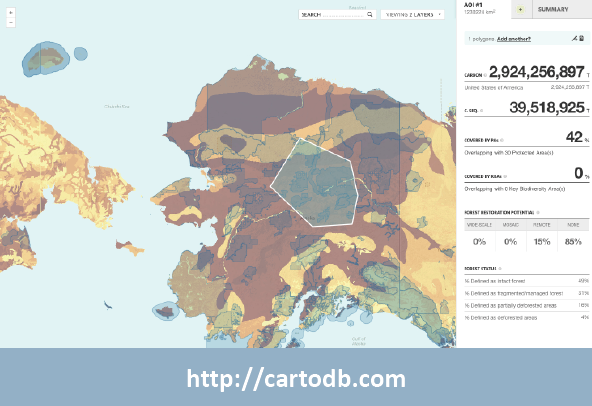
CartoDB
CartoDB is a mapping, real-time analysis and visualization service for building spatial applications.
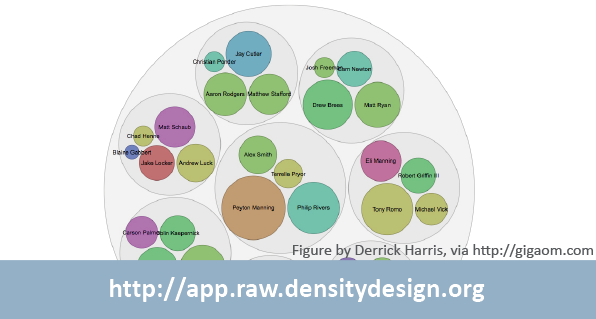
RAW
RAW is an open source web tool for quickly creating a variety of custom, vector-based visualizations.
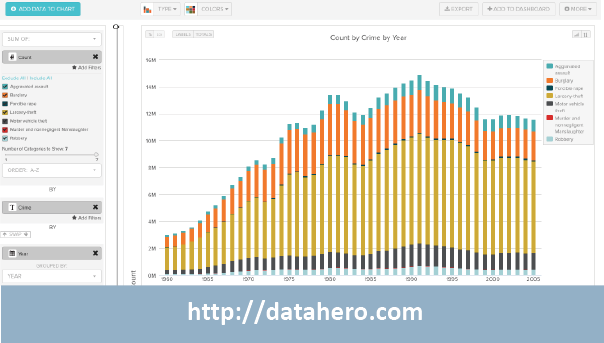
DataHero
DataHero is a powerful tool for quickly visualizing your datasets via uploaded files or other services like Google Docs.
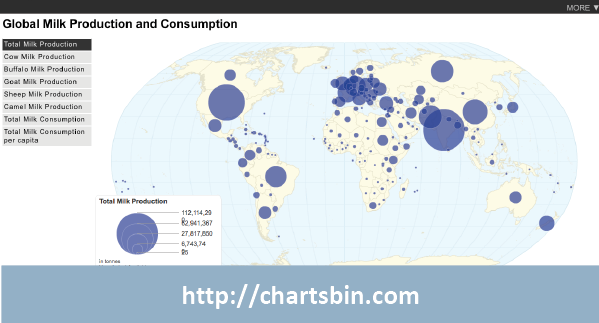
ChartsBin
With ChartsBin you can quickly create interactive, geocoded maps and bar graphs.
If you’re hungry for more, check out these other online tools for data presentation:
- Google Fusion Tables, spreadsheet charts, pivot tables, all available in Google Drive–https://support.google.com/drive/#topic=2799627
- Silk– https://silk.co –create interactive databases for people to explore
- Datavisual– https://datavisu.al –create charts and graphs with multiple datasets
- Polychart– https://www.polychart.com –easy drag/drop interface for charts, requires download
- Plotly– https://plot.ly –has it’s own API and accepts a wide variety of data formats including MATLAB
- Datawrapper – https://datawrapper.de –open source tool for creating simple, attractive charts


